

Understanding Hammer Candlestick Patterns
Discover how hammer candlestick patterns signal potential trend reversals in trading 📉. Learn to spot hammer and inverted hammer candles for smarter moves in South African markets 📊.
Edited By
Benjamin Wright
Bullish candlestick patterns are among the most useful tools traders use to spot potential upward price movements in various markets, from stocks and forex to commodities. These patterns provide quick visual signals about market sentiment, helping you anticipate buying opportunities and manage risk more effectively.
Candlestick charts originated in Japan and have become a global staple. Each candlestick represents price action over a specific period, showing the opening, closing, high, and low prices. A bullish candlestick typically indicates that buyers pushed the price up during that interval.

Understanding how to read and interpret these bullish patterns gives you an edge in timing your trades, especially in markets influenced by local and global factors — such as the JSE, forex pairs involving the rand, or commodities like gold and platinum.
A candlestick turns bullish when the closing price is higher than the opening price. This forms a body (the thick part of the candle) which is normally shown in green or white on many platforms. The length of the body reflects the strength of buying pressure; a long body means strong buying interest.
The shadows, or wicks, above and below the body show the intraday highs and lows. A small lower wick with a long upper wick often signals buyers are firmly in control.
Here are some common bullish candlestick patterns you should recognise:
Hammer: A small body near the top with a long lower wick, signalling potential reversal after a downtrend.
Bullish Engulfing: A small bearish candle followed by a larger bullish candle completely engulfing the first, indicating a possible trend change.
Morning Star: A three-candle pattern signalling a strong reversal, often appearing after a downtrend.
These patterns are practical in all markets but can be particularly helpful during local events that affect price volatility, like SARB rate announcements or changes in mining export figures.
In short, spotting bullish candlestick patterns helps you get ahead of the market mood, allowing you to make more informed decisions on entry and exit points.
Understanding the psychology behind these shapes can also improve your trading discipline and risk management, which are key for success in volatile environments, including South Africa’s markets.
Bullish candlestick patterns signal a possible upward movement in an asset's price, offering traders practical clues about when to buy or hold. These patterns visualise the tug-of-war between buyers and sellers during a specific trading period. Spotting them correctly can improve your timing and help protect your capital against sudden downturns.
Each bullish candlestick consists of four basic components: the open, close, high, and low prices. The open price marks where the asset started trading within the session, while the close represents where it finished. The highest and lowest points of trade during that period form the high and low respectively. Understanding these basics helps you read the candlestick accurately on any chart.
Visual indicators show upward price movement clearly. If the close price is higher than the open, the candlestick body tends to be green or white, signalling buyers pushed prices up. A long body indicates strong buying pressure, while short shadows (wicks) suggest prices stayed near the session’s open or close. For example, a JSE stock showing a firm green candle after a dips hints that buyers are regaining control.
Bullish and bearish candlesticks differ mainly in the relationship between open and close prices. Bearish candles close lower than the open and often appear red or black, signalling selling pressure. Recognising this difference quickly helps traders gauge market momentum and make informed decisions.
A bullish pattern shows buyer strength overcoming sellers at that moment in time. When buyers outnumber sellers, the momentum pushes prices higher, which appears as a candlestick with a close above the open. This shift can be the early sign of a trend change or continuation.
Market sentiment and momentum play a large role here. Bullish candlesticks often appear when optimism ripples through the market, whether from positive news, strong earnings, or broader economic conditions. For instance, a favourable interest rate announcement from the SARB could ignite buying enthusiasm, visible as bullish patterns in local bank shares.
Candlesticks reflect trader behaviour by capturing the battle between bulls and bears on a single chart. Each candle tells the story of who dominated that trading period. Observing a series of bullish candles means the buyers have generally held control over multiple sessions, providing confidence in a potential price rise.
Recognising what bullish candlestick patterns represent allows you to connect price action with market psychology, enabling smarter trade entries and risk management tailored to South African market rhythms.
Understanding common bullish candlestick patterns gives traders reliable signals about potential upward price movements. These patterns help identify moments when buyers are gaining control after a period of selling pressure. Recognising these patterns in real time can improve your timing for entries and exits, increasing chances of profitable trades.
The hammer is a simple yet powerful single-candle pattern suggesting a potential reversal after a downtrend. It has a small body near the top, with a long lower wick that shows the price dipped low but buyers pushed it back up before closing. This indicates that selling pressure is weakening and buyers may start to dominate. For example, if a JSE blue-chip stock like Sasol forms a hammer at a key support level, traders might see this as a sign to buy.
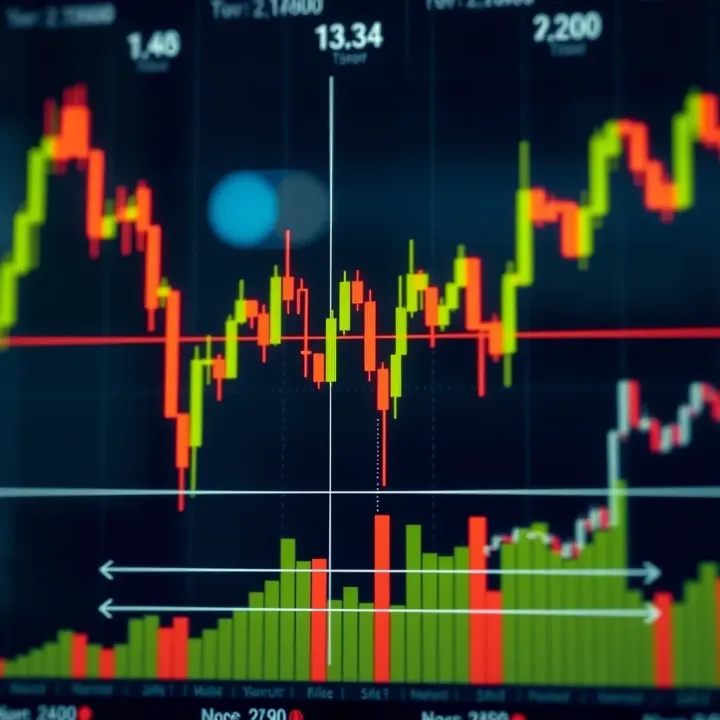
An inverted hammer also signals a possible upward reversal but looks like an upside-down hammer with a long upper wick and small body near the bottom. It shows buyers tried to raise the price during the session but sellers pulled it back, though not enough to regain control. The pattern gains significance if it appears after a downtrend, hinting at early buyer interest. In volatile forex pairs like USD/ZAR, spotting an inverted hammer can help time an entry when paired with other indicators.
This candle has a full-bodied shape with no wicks, opening at its low and closing at its high, signalling strong buying throughout the session. It reflects clear buyer dominance and momentum, often marking the start or continuation of an upward trend. Traders seeing a bullish Marubozu on stocks like Naspers or MTN may take it as a green flag to enter or add to long positions quickly.
The bullish engulfing pattern forms when a small bearish candle is immediately followed by a larger bullish candle that completely covers the previous body. This shift shows that buyers overwhelmed sellers and seized control. In real-world terms, this may happen after a sell-off in a stock like FirstRand, and the engulfing pattern suggests a fresh push upward.
This pattern occurs over two days: the first candle is bearish, and the second opens lower but closes more than halfway up the body of the first candle. It represents a strong buying reaction following selling pressure, hinting at possible trend change. South African traders often use the piercing line along with volume confirmation, especially when watching resource shares reacting to commodity price changes.
The morning star is a three-candle pattern signalling a potential bullish reversal. It starts with a long bearish candle, followed by a small-bodied candle showing indecision, then a strong bullish candle closing well into the first candle’s body. This pattern reflects a market shift where sellers lose traction and buyers take over. For example, spotting a morning star on shares like Clicks Group after a downtrend can offer a solid buy setup.
Spotting these patterns alone won’t guarantee success, but they provide useful clues when combined with volume, trendlines, or moving averages. The key is to use them as part of a broader trading plan tailored to your risk appetite and market context.
Bullish candlestick patterns don’t act in isolation. Their true power emerges when combined with other technical tools. Relying solely on these patterns can be risky, especially in volatile or uncertain markets. Using additional indicators helps confirm signals, improving your chances of spotting genuine buying opportunities.
Moving averages smooth out price action and highlight the overall trend direction. For example, a bullish candlestick pattern appearing near the 50-day moving average might suggest a stronger upward move if prices bounce off that level. This line often acts like a dynamic support or resistance zone. When a bullish pattern forms just above or at a moving average, it may signal buyers stepping in after a pullback.
Support levels are price points where demand tends to prevent further falls. If a bullish pattern emerges near a well-established support zone, that's a good sign buyers are guarding that price. Consider the JSE’s Sasol stock dropping to a previous low then forming a hammer candlestick; this pattern indicates it might rebound from that support. Traders should watch for these zones to increase confidence in bullish signals.
Volume shows the strength behind price moves. A bullish candlestick backed by above-average volume carries more weight; it means buying interest isn’t just a flash in the pan. For instance, if a bullish engulfing pattern on MTN shares coincides with a spike in volume, that’s a clearer sign the market supports the upward shift. Without volume backing, patterns can give false hope.
Bullish patterns aren’t always reliable, particularly during strong downtrends. Spotting a bullish hammer in a bear market does not guarantee a reversal; it might just be a brief pause. Understanding the broader trend helps avoid chasing false hope. For example, if a bullish pattern appears in the middle of Eskom-related panic selling, it’s wise to wait for additional confirmation before acting.
Indicators like the Relative Strength Index (RSI) and Moving Average Convergence Divergence (MACD) can clarify whether the market is oversold or gaining momentum. A bullish candlestick paired with an RSI below 30 (oversold zone) can highlight a better entry point. Likewise, a rising MACD line alongside bullish patterns points to strengthening momentum. These tools help filter out weaker signals.
Even the strongest signals can fail. Managing risk through stop-loss orders and position sizing protects your capital. For example, setting a stop-loss just below the low of a bullish pattern limits losses if the market turns sour. This approach is crucial in unpredictable local contexts where sudden news or loadshedding disruptions might impact market moves.
Bullish candlestick patterns are useful guides, but pairing them with other indicators and prudent risk controls sharpens your trading edge.
Combining these elements will help you spot higher-probability trades, avoiding common pitfalls and improving your overall trading results across markets like the JSE or forex pairs involving the rand.
South African investors often look for bullish candlestick patterns in blue-chip shares listed on the Johannesburg Stock Exchange (JSE), such as Naspers, Sasol, and Standard Bank. These stocks tend to show clearer, more reliable candlestick formations because they have higher liquidity and less erratic price swings. For example, a bullish engulfing pattern forming on a Standard Bank chart around a support level could signal a good entry point for buyers anticipating upward momentum.
In contrast, forex pairs involving the South African rand, like USD/ZAR and EUR/ZAR, are known for their volatility. This means candlestick patterns often play out faster and with more noise. Traders need to be extra cautious about false signals when dealing with rand-cross pairs. Still, a hammer candlestick after a strong dip in USD/ZAR can hint that the market is trying to bounce back, especially if supported by increased volume and favourable global risk sentiment.
Economic announcements such as the South African Reserve Bank’s interest rate decisions, inflation statistics, or political developments can dramatically shift market sentiment almost instantly. These events often leave footprints on candlestick charts — like long wicks indicating sharp price reversals within the trading session. For instance, a sudden bullish marubozu after a positive SARB statement on inflation could reflect strong buying interest. Paying attention to such news helps traders understand whether a candlestick pattern signals a genuine trend or simply a knee-jerk reaction.
Choosing a trading platform with reliable charting tools matters a lot for spotting and interpreting bullish candlestick patterns. Platforms like EasyEquities, IG, or ThinkMarkets offer intuitive South African-market-focused charts with real-time data and technical indicators. Having access to features like adjustable timeframes and volume overlays can help you double-check the strength behind a bullish pattern before committing your capital.
Loadshedding remains a reality for many South African traders and can affect internet connectivity, leading to disruptions in live data feeds. It's wise to use a stable backup internet connection, such as mobile data on a good network like Vodacom or MTN, to maintain chart access during power cuts. Having an offline plan—like setting alerts or using mobile apps with historical chart access—can keep you informed even when the lights go out.
Monitoring live charts can chew through data quickly, which adds up to higher costs. To manage this, consider setting your chart refresh rates less frequently, or use data-saving modes some platforms offer. Also, using Wi-Fi where possible or taking advantage of affordable data bundles for trading times lowers expenses. Efficient use of these resources ensures you stay updated without breaking the bank.
Bullish candlestick analysis in South African markets demands more than just pattern recognition. Practical challenges like loadshedding, data costs, and economic news impact must be factored in to make confident trading decisions.
By understanding these local quirks and using the right tools, traders can better interpret bullish signals and improve their chances of successful trades on the JSE or in forex markets involving the rand.
Understanding the limitations of bullish candlestick patterns is just as important as recognising them. While these patterns offer valuable clues, treating them as foolproof signals can lead to costly mistakes. Traders often expect these patterns to guarantee price rises, but market behaviour rarely conforms so neatly. A realistic view helps manage expectations and improves trading decisions.
Bullish candlestick patterns indicate a higher probability of an upward move rather than a guarantee. For instance, a bullish engulfing pattern suggests buyers are gaining control, but it doesn't ensure new highs will follow. Market conditions and other factors still influence whether the move continues or retraces. Think of it like a weather forecast saying there’s a 70% chance of rain; it’s likely but not certain.
In practice, this means traders should view these signals as cues to watch the market closely instead of executing trades blindly. Combining the pattern insight with volume spikes, trend confirmation, or support levels increases the chance of success.
Depending only on candlestick patterns can backfire surprisingly fast. Markets often shake out naive traders by producing false signals—patterns that look bullish but then quickly reverse. For example, during news releases, a bullish pattern can form just before volatility sends prices plummeting.
Relying solely on candlesticks ignores such outside factors and can lead to entering trades too early or holding losing positions too long. South African traders, especially during volatile periods like forex after Pretoria's interest rate announcements, benefit from using these patterns alongside other confirmation methods.
The reliability of bullish candlestick patterns varies with the timeframe and current market state. On a daily chart, a morning star pattern might signify a genuine trend reversal, while on a 5-minute chart it could be mere noise. Similarly, in sideways ranges, bullish patterns might fail more often than during strong trends.
Understanding the timeframe you trade and the current market mood—volatile or calm—helps weight the pattern’s significance properly. For example, blue-chip shares on the JSE tend to show stronger signals on longer timeframes compared to minute-by-minute forex pairs.
Sudden news or economic data releases can wipe out bullish patterns in an instant. A solid morning star pattern might be overtaken by Eskom’s announcement of stage 4 loadshedding, rattling investor confidence. External shocks like global market sell-offs or Rand weakness due to political uncertainty also play a big role.
Traders need to be mindful of economic calendars and current affairs, remembering that even the most promising pattern can get derailed by unexpected events.
A robust approach mixes candlestick analysis with other technical tools—moving averages, volume, RSI, or trendlines. This combination filters out weak signals and improves timing. For instance, spotting a bullish engulfing pattern near a strong support level confirmed by rising volume offers a better trading setup.
For South African traders especially, integrating local market nuances like municipal service delivery impacts or forex spreads with candlestick reading enhances decision-making. Best practise includes setting stop losses and looking for multiple indicator confirmations before pulling the trigger.
Bullish candlestick patterns provide useful insights but should never be treated as standalone signals. Combining them with other tools and contextual knowledge increases their trading value and protects against avoidable losses.
Discover how hammer candlestick patterns signal potential trend reversals in trading 📉. Learn to spot hammer and inverted hammer candles for smarter moves in South African markets 📊.
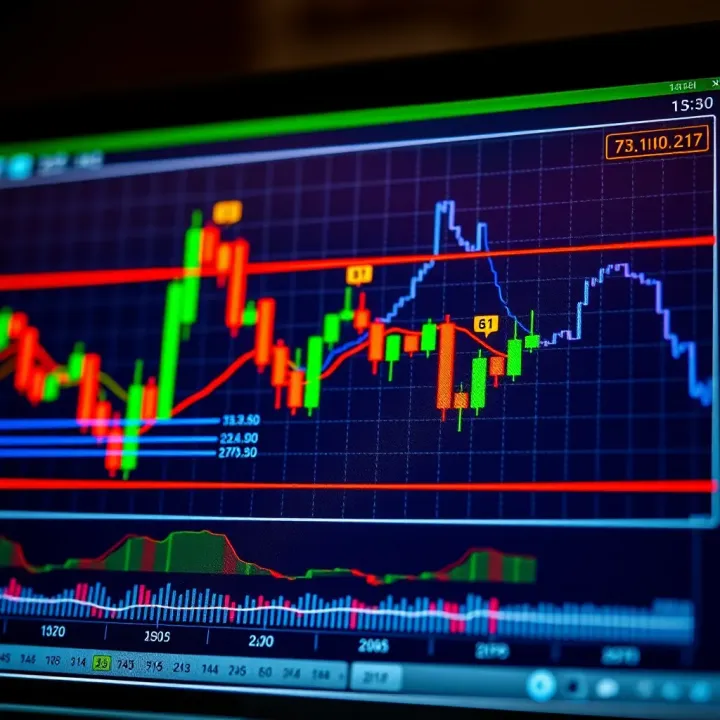
📈 Master key chart patterns South African traders rely on. Spot, interpret, and use them confidently with a handy PDF cheat sheet tailored for local markets.

Discover key high profit candlestick patterns 📈 and learn how to apply them in trading. Includes practical tips and free PDF guides to boost your strategy 📊.

📊 Master candlestick patterns with clear guides and practical PDFs designed for South African traders. Learn key chart signals to make smarter market choices. 📈
Based on 10 reviews